
3. Climate Change: Current CO2 Emissions
- Joseph Gasper
- Jan 29, 2020
- 5 min read
3 Current CO2 Emissions
3.1 World CO2 Emission
During the 1970s, scientific opinion increasingly favored the global warming viewpoint. By the 1990s, as a result of improving fidelity of computer models and observational work, a consensus position formed: greenhouse gases were deeply involved in most climate changes and human-caused emissions were bringing discernible global warming. CO2 concentrations are rising mostly because of the fossil fuels that people are burning for energy. Fossil fuels like coal and oil contain carbon that plants pulled out of the atmosphere through photosynthesis over the span of many millions of years; we are returning that carbon to the atmosphere in just a few hundred years. As reported by the Global Carbon Project (https://www.globalcarbonproject.org/carbonbudget/)

Electricity/heat generation (44%) and transport (20%) account for two thirds of total CO2 emissions and were equally responsible of almost the entire global growth in emissions since 2010; the remaining third is split between industry (26%) and buildings (11%). The contribution of countries that contribute more than 2% to total global emission of CO2 are

The contributions of those entities that each contribute less than 2% of total CO2 emissions

There is variation in the reported amount of carbon emitted per year from various sources as shown in the following graph. Based on this data there is a standard deviation of ~5% in the reported data.

3.2 US CO2 Emissions
In 2017 the transportation, electricity and industry sectors accounted for ~80% of the US GHG emissions (https://www.epa.gov/ghgemissions/sources-greenhouse-gas-emissions). Of the GHG source categories, carbon dioxide (CO2) emissions from fossil fuel combustion account for the largest percentage (76%) of total U.S. GHG emissions. Among the sectors, transportation contributes the largest percentage (36%) of CO2 emissions from fossil fuel combustion, with electric power second at 35%.
Figure 3.2-1

Since 1990 to 2017 GHG emissions have increased 1.3% and have decreased from their peak in 2007 by 12% in 2017. It needs to be noted that the “Great Recession” accounted for an 8% reduction. (https://www.epa.gov/ghgemissions/inventory-us-greenhouse-gas-emissions-and-sinks)

The change in each sector from 2009 to 2017

The Rhodium Group estimates that energy-related CO2 emissions increased by 3.4% in 2018. That’s the second largest annual gain since 1996 — surpassed only by the 3.6% increase that occurred in 2010, when emissions rebounded from a recession-driven 7.2% decline the year before (https://rhg.com/research/preliminary-us-emissions-estimates-for-2018/). While they don’t expect a repeat of 2018 this coming year, the data provides some important insights into the emission reduction challenges facing the US.
The Rhodium Group provided preliminary estimates for economy-wide emissions in 2018 using recently released Environmental Protection Agency (EPA) inventory estimates for 2017. Their methodology is consistent with reporting guidelines for countries tracking progress toward their national commitments under the UN Framework Convention on Climate Change. They estimate that economy-wide emissions increased by 1.5% to 2.5% in 2018 (https://rhg.com/research/final-us-emissions-estimates-for-2018/).

Note that only the electricity sector has decreases as gas replaces coal in electricity production.
3.2.1 Transportation
At a 2003 workshop (https://www.osti.gov/biblio/828939) it was stated that because of its operating characteristics, price structure, dependence on virtually one energy source (oil), enormous installed infrastructure, and limited technology alternatives, the transportation sector will likely represent a particularly difficult challenge for CO2 emissions mitigation. Although, the technological alternative for cars was fully developed by the start of this decade with the advent of cars powered partially or fully by Lithium batteries, the increase in the GHG emitted by the transportation sector shows this continues to be the case.
Progress on electric vehicle adoption has been slow: In the U.S., close to 200,000 electric vehicles (EV) both plug-in hybrid electric vehicles (PHEV) and battery-electric vehicles (BEV) were sold in 2017, out of 17,340,700 vehicles. In 2018 361,000 EV sold in 2018 out of 17,274, 250 so progress is being made (https://www.citylab.com/transportation/2018/10/where-americas-charge-towards-electric-vehicles-stands-today/572857/ at a slow rate. Despite the introduction of electric vehicles (Sales of plug-in passenger cars achieved a 2.1% market share of new car sales in 2018, up from 1.3% in 2017, and 0.86% in 2016. The US EV market share was 1.8% in 2018) and fuel efficiency standards the magnitude of the challenge is illustrated by fact that GHG emissions from transportation has increased 22.2% from 1990 to 2017.

Gasoline accounts for about 70% fuel used in transportation while distillate fuel oil (diesel) accounts for 30%. Almost nothing has been down to address diesel CO2 emission. Despite fuel efficiency standards and electric vehicles, the US is currently using more fuel than in 2009
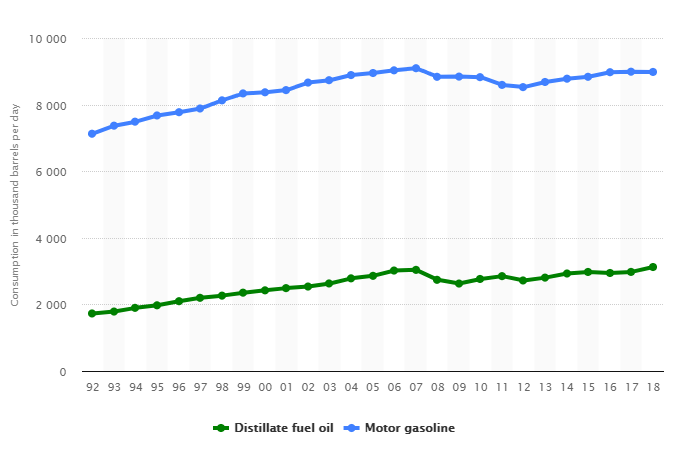
(https://www.statista.com/statistics/189410/us-gasoline-and-diesel-consumption-for-highway-vehicles-since-1992/).
3.2.2 Electricity
Diversity is a key attribute of electricity generation construction in the United States (https://www.nrel.gov/docs/fy17osti/67645.pdf). Rather than being the result of a deliberative, long-term national initiative, this diversity has developed through growth spurts of specific generation technologies at different times, often due to a confluence of policies, historic events, capital cost, fuel cost, and technological advancements. As shown in the following figure, most generation sources have experienced eras of significant capacity growth: hydro (1930‒1950, not shown); coal (1950-1985); nuclear (1960‒1980); natural gas (1990‒2010); and renewables/natural gas (2005‒present).

The U.S. generation fleet is transitioning from one dominated by centralized generators with high inertia and dispatchability to one that is more hybridized, relying on a mixture of traditional, centralized generation and variable utility-scale and distributed renewable generation.
From 2005 to 2015, the generation mix has changed significantly. In 2005, the top six generation sources in descending order were coal, nuclear, gas, hydro, petroleum, and non-hydro renewables. By 2015, gas and coal were tied at the top, followed by nuclear, non-hydro renewables, hydro, and petroleum.

Figure ES-2. Annual net generation from all sectors
Natural gas and non-hydro renewable generation grew from 2005 to 2015, while coal and petroleum generation decline.
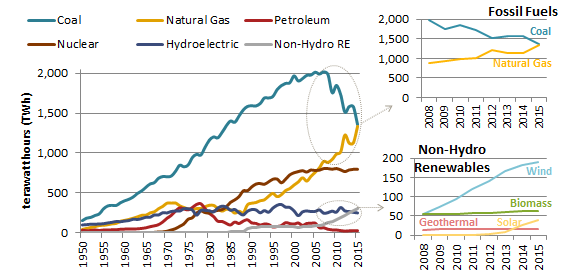
Coal generation began to decline in 2007 and has largely been replaced by natural gas. Although solar and wind make up a much smaller portion of total generation, these technologies have also seen significant growth since 2008. (https://www.nrel.gov/docs/fy17osti/67645.pdf)
Several factors played a role in these recent changes. Due in large part to technological advances—particularly directional drilling and hydraulic fracturing U.S. natural gas production increased dramatically (by 50%) between 2005 and 2015. In 2016, production declined by 2% compared to 2015 levels but increased slightly in 2017 (about 1% higher than 2016). Relatedly, the weighted average annual price of natural gas dropped by about 60% between 2005 and 2015. By comparison, the weighted average annual coal price increased by about 40% during that time frame. This change in relative fuel prices played a key role in altering the economics of power generation (i.e., order of dispatch), leading to some natural gas displacement of coal in particular regions of the country. These market forces have played a role in the retirement of coal-fired electric power plants: Between 2006 and 2016, the number of coalfired power plants decreased from 353 to 230. (U.S. Carbon Dioxide Emissions in the Electricity Sector: Factors, Trends, and Projections, January 7, 2019 https://fas.org/sgp/crs/misc/R45453.pdf)


Comments