
4. Climate Change: Projected CO2 Emission Based on Current Trends
- Joseph Gasper
- Jan 28, 2020
- 5 min read
4 Projected CO2 Emission Based on Current Trends
4.1 World Projections
The OECD report of 2011, OECD ENVIRONMENTAL OUTLOOK TO 2050: The Consequences of Inaction (https://www.oecd.org/g20/topics/energy-environment-green-growth/oecdenvironmentaloutlookto2050theconsequencesofinaction.htm), projected CO2 emissions for 2020 as 37.5 GtCO2 (https://read.oecd-ilibrary.org/environment/oecd-environmental-outlook-to-2050/climate-change_env_outlook-2012-6-en#page13). The OECD projection was based on a Baseline Scenario. The “Baseline” scenario for this report reflects a combination of no new policies and continuing socioeconomic trends. Under the Baseline, pressures on the environment from population growth and rising living standards will outpace progress in pollution abatement and resource efficiency. Continued degradation and erosion of natural environmental capital is expected to 2050, with the risk of irreversible changes that could endanger two centuries of rising living standards. The International Energy Agency (IEA) estimates that unless policies prematurely close existing facilities, 80% of projected 2020 emissions from the power sector are already locked in, as they will come from power plants that are currently in place or under construction. Under the Environmental Outlook Baseline, demand for energy is projected to increase by 80% between 2010 and 2050. Transport emissions are projected to double between 2010 and 2050, due in part to a strong increase in demand for cars in developing countries, and growth in aviation. However, CO2 emissions from land use, land-use change and forestry (LULUCF), driven in the last 20 years by the rapid conversion of forests to grassland and cropland in tropical regions, are expected to decline over time and even become a net sink of emissions in the 2040-2050 timeframe in OECD countries. The Global Carbon Project (https://www.globalcarbonproject.org/carbonbudget/index.htm) reports a value of 37.1 GtCO2 for 2018, which is consistent with the projection of the 2011 OECD report. This supports the conclusion that the world remains on a business as usual path way.
Figure 4.1 – 1
OECD 2011 Projected CO2 Emissions

The Energy Information Agency (EIA) annually issues long term energy projections that include CO2 emissions. The 2019 International Energy Outlook (IEO) presents an analysis of long-term world energy markets in sixteen regions through 2050 (https://www.eia.gov/outlooks/ieo/). EIA develops the IEO using the World Energy Projection System Plus (WEPS+), an integrated economic model that captures long-term relationships among energy supply, demand, and prices across regional markets under various assumptions.
The IEO Reference case provides a baseline to measure the impact of alternative assumptions. The Reference case reflects current trends and relationships among supply, demand, and prices in the future. It is a reasonable baseline case to compare with cases that include alternative assumptions about economic drivers, policy changes, or other determinants of the energy system to estimate the potential impact of these assumptions. The Reference case includes some anticipated changes over time:
– Expected regional economic and demographic trends, based on the views of leading forecasters
– Planned changes to infrastructure, both new construction and announced retirements
– Assumed incremental cost and performance improvements in known technologies based on
historical trends.
The report includes side cases that address two significant sources of uncertainty. To see the impact of economic growth on energy consumption, EIA adjusted the assumptions about regional factors of growth in the High and Low Economic Growth cases. The resulting compound annual growth rates of global gross domestic product (GDP) during the projection period (2018–2050) vary from the Reference case as follows:
– 3.7% per year, High Economic Growth case
– 3.0% per year, Reference case
– 2.4% per year, Low Economic Growth case.
The High and Low Oil Price cases address the uncertainty associated with world energy prices. EIA
altered the assumptions about both oil supply and demand to achieve higher and lower oil prices, as
seen in the 2050 price of North Sea Brent crude oil in 2018 dollars:
– $185/barrel, High Oil Price case
– $100/barrel, Reference case
– $45/barrel, Low Oil Price case.
Reference case energy-related carbon dioxide emissions grow
Figure 4.1 – 2
EIA International Energy Outlook 2019

accelerating in later projection years in non-OECD countries.
• World energy-related CO2 emissions grow at an average rate of 0.6% per year between 2018 and 2050, compared with the average growth rate of 1.8% per year from 1990 to 2018.
• In the near term, energy-related CO2 emission growth is slowed by increases in energy efficiency and a gradual shift from coal toward natural gas and renewable energy sources. In the longer term, broad population and economic growth leads to increased emissions.
• In OECD countries, projected energy-related CO2 emissions decline slightly (-0.2% annually) through 2050 and are 14% lower than their 2005 levels in 2050 even as their economies gradually expand.
• Energy-related CO2 emissions from non-OECD countries grow at a rate of about 1% per year from 2018 to 2050, slower than the related growth in energy consumption (1.6% per year).
Looking deeper into the EIA IEO the assumptions on CO2 emissions are that “developed” nations stabilize or slightly reduce their carbon emissions while “developing countries increase their emissions.
4.2 US Projections
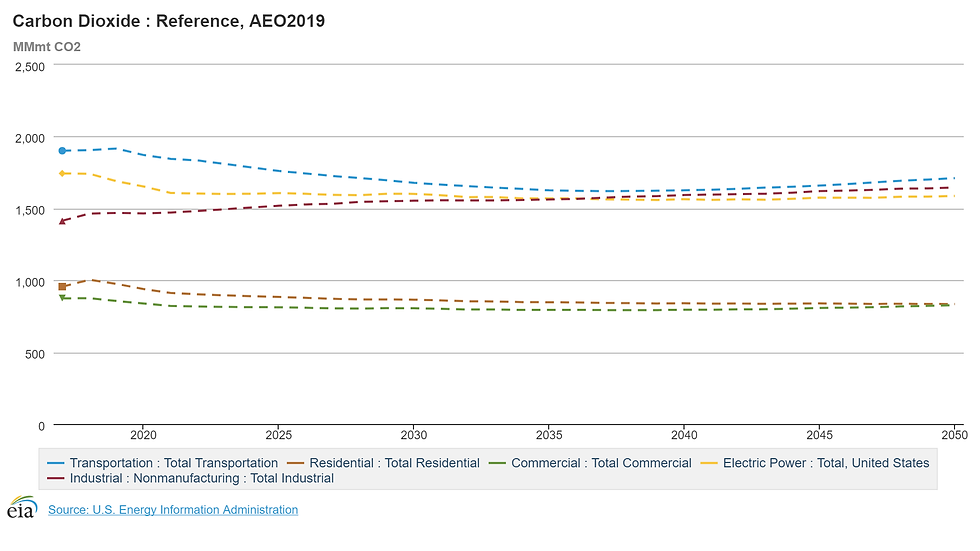
Carbon dioxide emissions from U.S. energy consumption will remain near current levels through 2050, according to projections in EIA’s Annual Energy Outlook 2019. (https://www.eia.gov/todayinenergy/detail.php?id=38773)

The AEO2019 Reference case, which reflects no changes to current laws and regulations and extends current trends in technology, projects that U.S. energy-related carbon dioxide (CO2) emissions will be 5,019 million metric tons in 2050, or 4% below their 2018 value, as emissions associated with coal and petroleum consumption fall and emissions from natural gas consumption rise. The breakdown by sector
4.2.1 Electrical Generation
Based EIA’s Annual Energy Outlook 2019 emissions of CO2 from electrical generation reduce slightly and then stabilize principally as a result of increased generation by natural gas and renewables.


• The United States adds 72 gigawatts (GW) of new wind and solar photovoltaic (PV) capacity between 2018 and 2021, motivated by declining capital costs and the availability of tax credits.
• New wind capacity additions continue at much lower levels after production tax credits expire in the early 2020s. Although the commercial solar Investment Tax Credits (ITC) decreases and the ITC for residential owned systems expires, the growth in solar PV capacity continues through 2050 for both the utility-scale and small-scale applications because the cost of PV declines throughout the projection.
• Most electric generation capacity retirements occur by 2025 as a result of many regions that have surplus capacity and lower natural gas prices. The retirements reflect both planned and additional projected retirements of coal-fired capacity. On the other hand, new high-efficiency natural gas-fired combined cycle and renewables generating capacity is added steadily through 2050 to meet growing electricity demand.
• Coal-fired generating capacity declines faster than coal-fired generation through 2050, with 101 gigawatts (GW) (or 42% of existing coal-fired capacity) projected to retire by 2050. For nuclear generators, 22 GW (22% of current nuclear capacity) retires by 2050.
• From 2018 to 2021, wind builds play a more significant role in total capacity additions, accounting for 20% of the additions. Over time, solar generation grows for both the utility- and small-scale sectors. 43% of total capacity additions through 2050 are solar photovoltaic capacity.
4.2.2 Transportation
CO2 from the transportation sector decrease then increase slightly

Transportation energy consumption declines between 2019 and 2037 because increases in fuel economy more than offset growth in vehicle miles traveled. Continued growth of on-road travel increases energy use later in the projection period because current fuel economy and greenhouse gas standards require no additional efficiency increases for new light-duty vehicles after 2025 and for new heavy-duty vehicles after 2027.

4.2.3 Industrial Sector
CO2 from the increases slowly as total industrial delivered energy consumption grows 0.9% per year on average from 2018 to 2050. All fuels, except coal, have a similar growth rate, declining slightly during the projection period. Industrial energy consumption grows more slowly than economic growth because of increasing energy efficiency.


Comments